How to Use Energy Profiles to Find Energy Waste
The patterns (or profiles) of energy usage contained within interval energy data are great for discovering where a building is wasting energy. The fine-grained detail of interval data (such as half-hourly data) is key – daily, weekly or monthly data doesn't carry anywhere near as much information about how energy is being used.
- Energy profile charts and how to create them
- How to look at energy profiles – a general philosophy
- Understand the building to understand the energy profiles
- Examples of energy waste shown in energy profiles
Energy profile charts and how to create them
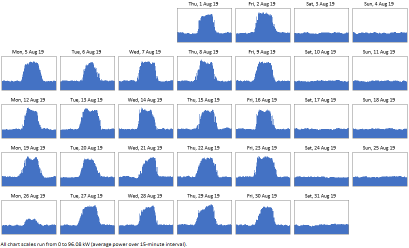
Patterns of energy usage are often referred to as energy profiles. An example of a month's worth of energy profiles is shown below:

How to create energy profiles from interval data
The charting features of Microsoft Excel will allow you to create your own energy profiles from interval data. However, you may wish to make the process faster and easier with specialist software such as Energy Lens.
How to look at energy profiles – a general philosophy
Looking at energy profiles to find energy waste requires you to have some knowledge of the way that the building is operated. The key is to try to link the patterns of energy usage with the operations of the building.
Energy profiles show how much energy is being used at particular times-of-the-day and days-of-the-week – you want to be able to have a pretty good idea of what equipment is using that energy, and why it needs to be using it at the times in question.
If the profiles show energy being used on times or days when you're not aware of a good reason for energy to be used, that's an indication that energy is possibly being wasted, and something for you to investigate.
Understand the building to understand the energy profiles
To make sense of the energy profiles, you need to have good idea about what goes on in the building. Not everything that goes on in the building, just the things that relate to energy consumption.
Every building is different, but the following factors are commonly relevant:
Occupancy – when people come and go
- What are the core occupancy hours (e.g. 9 to 5)? Are there multiple shifts (e.g. a day shift and a night shift)?
- Do people ever work on-site outside of the core occupancy hours? Do certain staff stay on after the official closing time? Does anyone come in on weekends or holidays?
HVAC – heating, ventilation and air conditioning

- What fuels are used for heating (e.g. gas, electricity – see note below)?
- Is there air conditioning? Is it used just for cooling in summer, or is it used all year round (e.g. to keep equipment cool)?
- How is the heating controlled? Is it on a timer? When is it set to switch on and off? Are there different timer settings for weekends and holidays?
It's important to be aware that most forms of gas heating also use electricity for fans, pumps and controls. For example, for a heating system consisting of a gas boiler connected to radiators, 5% or more of the total energy used will typically be electricity. This is particularly significant in cost terms because electricity usually costs several times more per kWh than gas.
Heating systems that involve ducted air will typically use a considerable amount of electricity (40% or so is not uncommon). Air conditioning also usually consumes a lot of electricity.
The upshot of this is that HVAC energy wastage can usually be identified from patterns of electricity consumption alone. But if you do have interval metering on your gas supply it's well worth taking a closer look at your patterns of gas consumption too.
Lighting

- What controls when the lights come on and off? Are they automatically controlled (e.g. by a sensor that detects movement or light-levels), or are they turned on and off by staff?
- Do lights remain on when they're not needed (e.g. when staff have gone home, or when they're on lunch-break)?
- Are there enough light-switches? For example, if one person is working late in a large open office, will they have to light the entire office just to light their desk?
NB Most buildings have different sets of lights for different purposes (e.g. a set of lights in the main office, a set of lights in the meeting rooms, a set of lights in the warehouse, a set of security lights outside). Your answers to the questions above may depend on which set of lights you're talking about.
Office equipment
- Do staff turn their computers off when they leave work?
- Is there office equipment such as photocopiers / printers? Is it turned off when not in use?
(NB Whilst interval data is perfect for looking at larger patterns and trends, it won't help you to figure out how much energy an individual computer or photocopier uses... For that task you'll want to plug a simple watt meter between the equipment and the wall socket.)
Other energy-consuming equipment / processes
This could include anything from a printing room, to a fork-lift-truck charger, to specialist production-line equipment.
- What processes or items of equipment exist that use energy?
- What sort of energy do they use (e.g. electricity, or gas, or both)?
- When do they use energy? When do the processes run? When is the equipment switched on and off?
It's important to note that industrial processes can often dwarf all other types of energy consumption in a building. If a building has processes or items of equipment that consume a lot of energy, even small changes to the way that they're operated can often make a big difference to the energy bill.
Examples of energy waste shown in energy profiles
If you've read the previous sections of this article, you should already have a pretty good idea of the sorts of patterns to look for in energy profiles. Following are a few examples of energy waste, and the energy profiles that help to identify them:
(NB The energy profiles shown below were made with the Energy Lens software, which makes it easy to create energy profiles from interval energy data. You can download a free trial of Energy Lens, and create your own energy profiles in the click of a button.
High out-of-hours energy consumption
Energy wastage is very common during "out-of-hours" periods (e.g. at night and on weekends). For example, the figure below shows a section of a calendar plot created using half-hourly data from an office building:

This example strongly indicates that out-of-hours consumption is excessive. In the out-of-hours periods (Thursday night, Friday night, Saturday and Sunday), the building is using around 35% of the energy that it uses in peak consumption periods.
It is often necessary for a certain amount of equipment to operate during out-of-hours periods (e.g. security lighting or a central computer room). However, it's rare for the out-of-hours consumption to need to be as high as is demonstrated by the above figure. Such patterns indicate that there is huge potential to save energy by reducing the out-of-hours energy consumption.
Poor automatic control (especially HVAC)
Energy uses such as HVAC (heating, ventilation and air conditioning) should usually be closely tied to the occupancy hours. Considerable energy is wasted if a building is heated or cooled when nobody is using it, or if an entire building is heated or cooled when only a couple of rooms are in use.

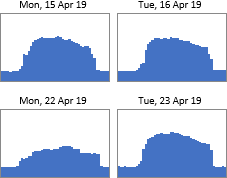
On the right is a section of a calendar plot for an office. It looks like some equipment (probably the heating) came on automatically on an unoccupied public holiday (Monday, 22nd April 2019).
The figure shows that the profile for the holiday Monday was different to that of the other weekdays nearby. Less energy was used over the daytime hours because nobody was in the office using equipment such as lights or computers. However, a fair amount of energy was used, even though the building was unoccupied. This indicates that something was erroneously set to come on automatically, heating being the most likely suspect.
A more severe example would be that of a building with a heating timer that only allows a single on-time and a single off-time (as opposed to allowing different times to be set on different days). It's not uncommon for buildings to have such a timer, even when they operate on Monday to Friday only – this results in considerable wastage as the heating comes on unnecessarily every Saturday and Sunday.
What next?
If you found this article useful, might you consider telling your colleagues or mentioning it on your website?
You might also be interested in our other articles on energy management / energy monitoring and targeting.
And you might like to take a look at our Energy Lens software – it makes it really easy to create energy profiles within Excel:
- See how businesses and other organizations can use Energy Lens to cut energy bills.
- See how energy consultants can use Energy Lens to analyze energy data faster.
- Download the free trial of Energy Lens.